Diving deeper into SDG 11: Discovering public and green spaces in urban environments
July 30, 2021
Erik Lehmann
In 2015, the United Nations adopted 17 Sustainable Development Goals (SDGs) as part of the Agenda 2030. They are a significant step towards a more sustainable world and are divided into 169 targets and 232 quantifiable indicators. Compared to their predecessors - the Millennium Development Goals (MDGs) - they have a broader scope by addressing ecological, social, and economic challenges. They are based on legally non-binding goals that have been agreed to by the UN member states. In one of our previous blog post, we introduced the GIZ Data Lab’s partnership with Colombia's National Administrative Department of Statistics (DANE) and the Partners4Review initiative to test various data-driven approaches on measuring SDG 11. It aims at improving urbanization and comprises safe and affordable housing as well as building resilient societies and economies. Policymakers, researchers, and city planners endorse higher investments in public transport and the creation of green and public spaces as they make urban environments more participatory and inclusive for all social groups. In this blog post, we introduce the calculation of indicator 11.7.1. and map the city of Medellin in terms of “universal access to safe, inclusive, and accessible, green and public spaces, in particular for women and children, older persons and persons with disabilities”. These open spaces have positive impacts on the quality of our lives and our environment. Being surrounded by green and public spaces is good for our physical and psychical health but it is also making neighborhoods more attractive and strengthen communities – especially when urban spaces are dense.
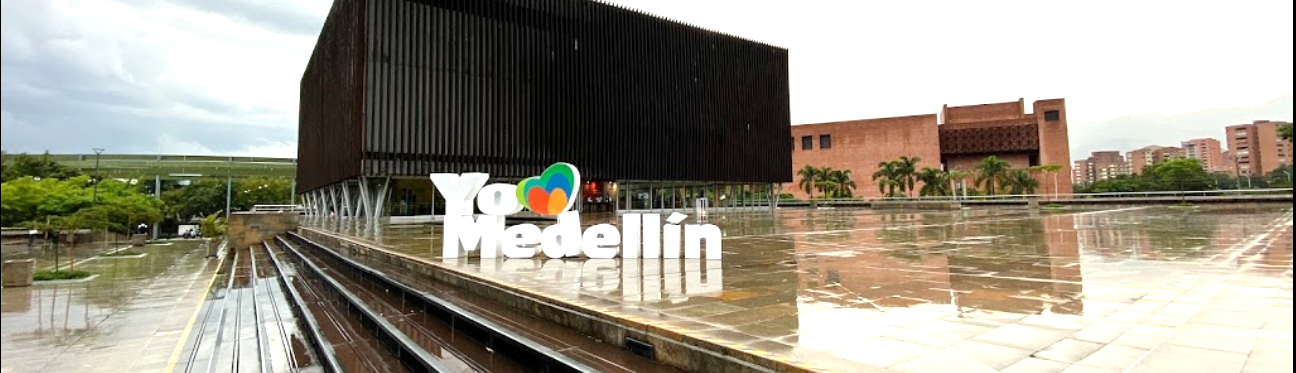
In our joint experiment, we explored how alternative open data sources can be used to map public and green spaces and urban build up area in Medellin. With its award-winning “Social Urbanism” the city is a great example of how the construction of social infrastructure - like improved access to education, mobility, and safer public spaces – impacts day-to-day life.
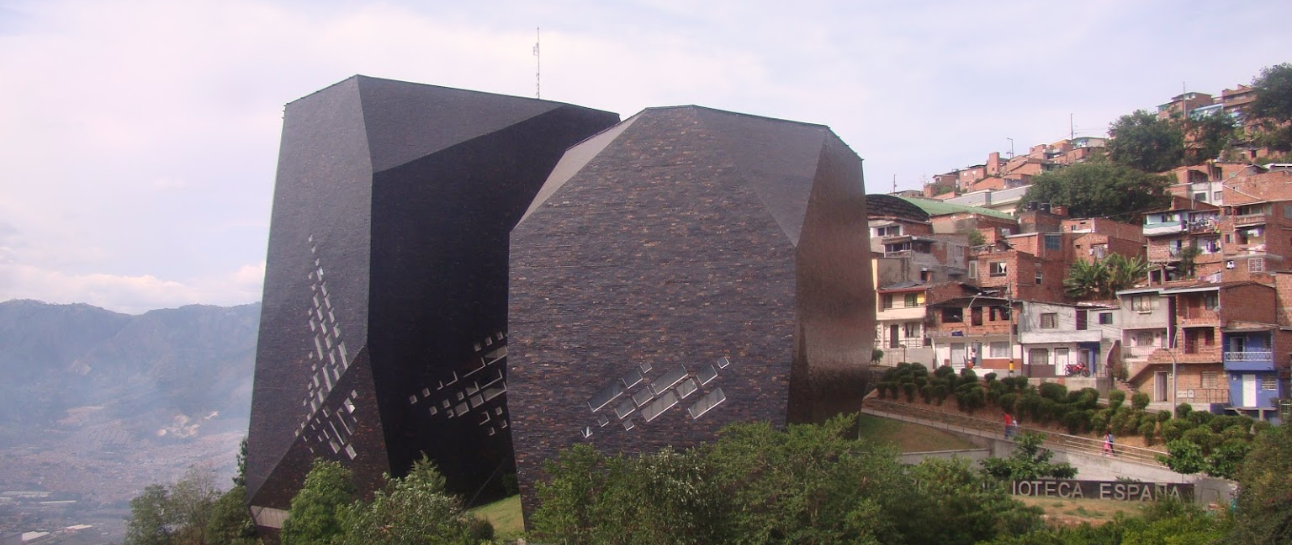
It’s Integrated Slum Upgrading Program was established in 1990 to address the great challenges caused by violence, social segregation, and urban inequalities. A major strength of the program is its community involvement. The “Parque Biblioteca España” (picture), an education center in the former informal settlement of Santo Domingo is a great example of integral urban projects where a team of architects, urbanists, social workers, and community representatives among others were involved.
Calculation of Indicator 11.7.1
“Indicators of SDG 11 have shown to be a challenge for several countries due to the demand for new methods and data sources. The indicator 11.7.1. is paramount in our strategy in terms of taking advantage of satellite imagery and the processing and analysis of those. The need to access detailed information about open spaces for public use is related to several other indicators which enable us to analyze and understand inequities in the cities we are inhabiting. Our approach aligns with the global perspective on SDG tracking and makes sure that no one is left behind.”
The indicator 11.7.1 - “Average share of the built-up area of cities that is open space for public use for all, by sex, age and persons with disabilities” monitors the share of land dedicated to public spaces - including parks, squares, recreational areas, and streets. However, this ratio comes with certain challenges: Next to limited data availability, there is only a little information on access for disabled citizens.
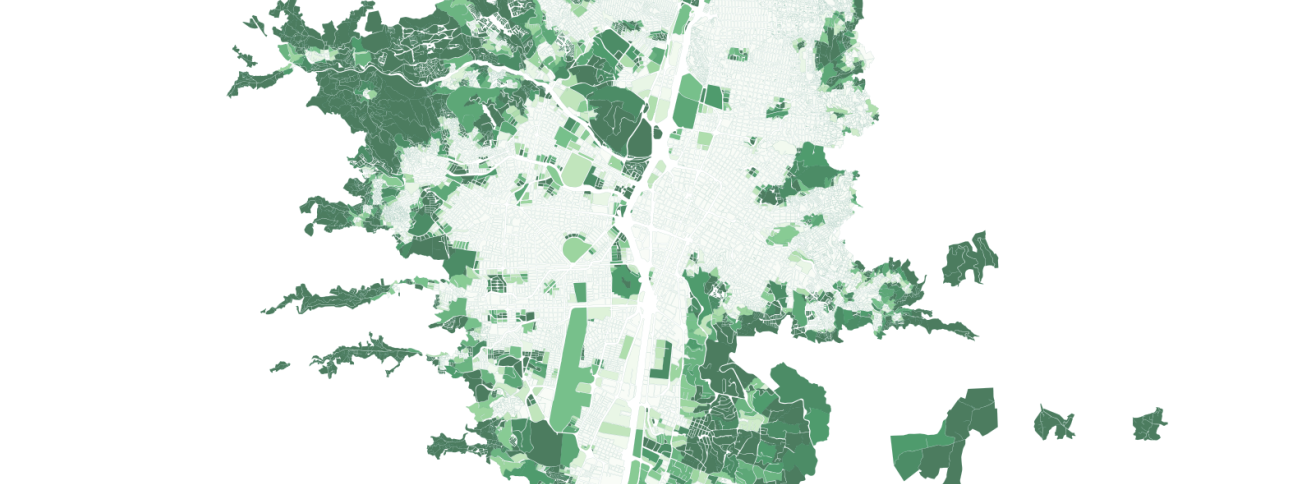
A simplified approach here is the determination of green spaces by calculating the Normalized Difference Vegetation Index (NDVI). NDVI is often used to monitor droughts or forecast agricultural production. It can be calculated from satellite imagery with the help of near-infrared light, which is not visible for humans but strongly reflected by vegetation. In a second step, a threshold is set to determine the green areas. The following map shows the percentage of areas with green vegetation by neighborhood. One can observe significant differences between neighborhoods, with southern El Poblado being the most verdant. In our urban growth analysis, we found that this neighborhood had the highest absolute population growth between 1990-2015. This kind of growth while maintaining the high proportion of green spaces, can only be realized by building upwards. In fact, the cityscape of El Poblado is characterized by its high-rise buildings. The previously informal settlements in the Popular district, on the other hand, are densely built and show only a limited amount of public, green spaces. However, the informative value of this approach is limited, since it does not provide information about "non-green" public spaces, buildings, streets, or their accessibility.
Loading data about public places from OpenStreetMap
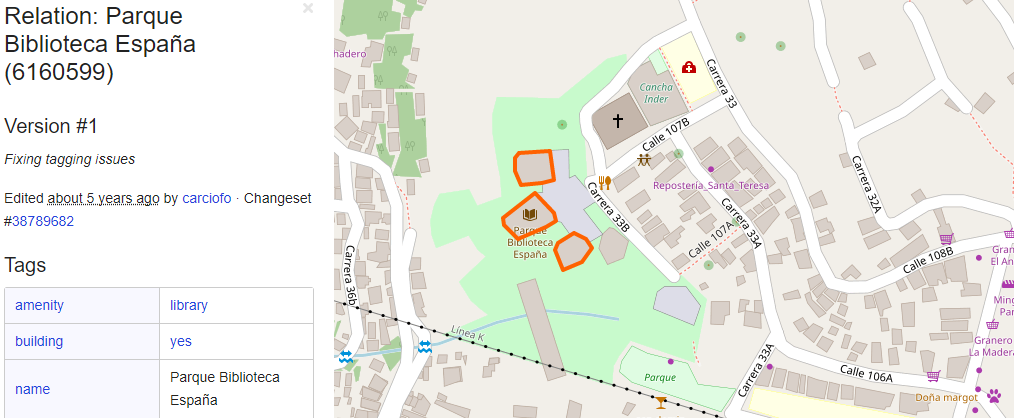
OpenStreetMap (OSM) is a community-sourced map service comparable with Google Maps, but unlike this, the data is open source. There are numerous ways to download high-quality data from OSM. As the data frames become very large quite quickly. We focused on the Overpass API. Overpass API allows us to query specific data points from the OSM set, in its own Overpass SQL-like query language. Some examples of the language can also be found in our repository. In our specific case, we used the previously mentioned “park library”, which can be found e.g. using the tag “amenity” equals “library”.
For the calculation of the indicator, we only map the surrounding green area and not the areas covered by buildings, as they do not represent open areas. This follows the recommendations from UN Habitat data team – however, in our approach, we noticed that this aspect is under discussion and overall assignment to open spaces is handled very differently in varying contexts and countries. limits the comparability of the indicator between countries.
Occasionally OSM also provides information on public accessibility. This allowed us for example to exclude golf courses from our consideration. Some entities also indicate access for people in wheelchairs. From this information, it is possible to infer and visualize local circumstances for all people with disabilities at this specific spot. Roads and parking lots, which our indicator also defines as public spaces, can be extracted from OSM as well. Unfortunately, roads have the disadvantage that they are marked as lines and thus do not reveal any information about their width. Therefore, we convert them into areas and distinguished between residential and other roads. This way, the assigned width has a substantial influence on the final indicator.
Since OSM is globally available, this process can be replicated for any other city. Nevertheless, the quality and completeness of the data depend on manual user input and should always be validated. If you would like to access our extensive description of the API including the tags and processing for all analytical steps please have a look on our GitHub.
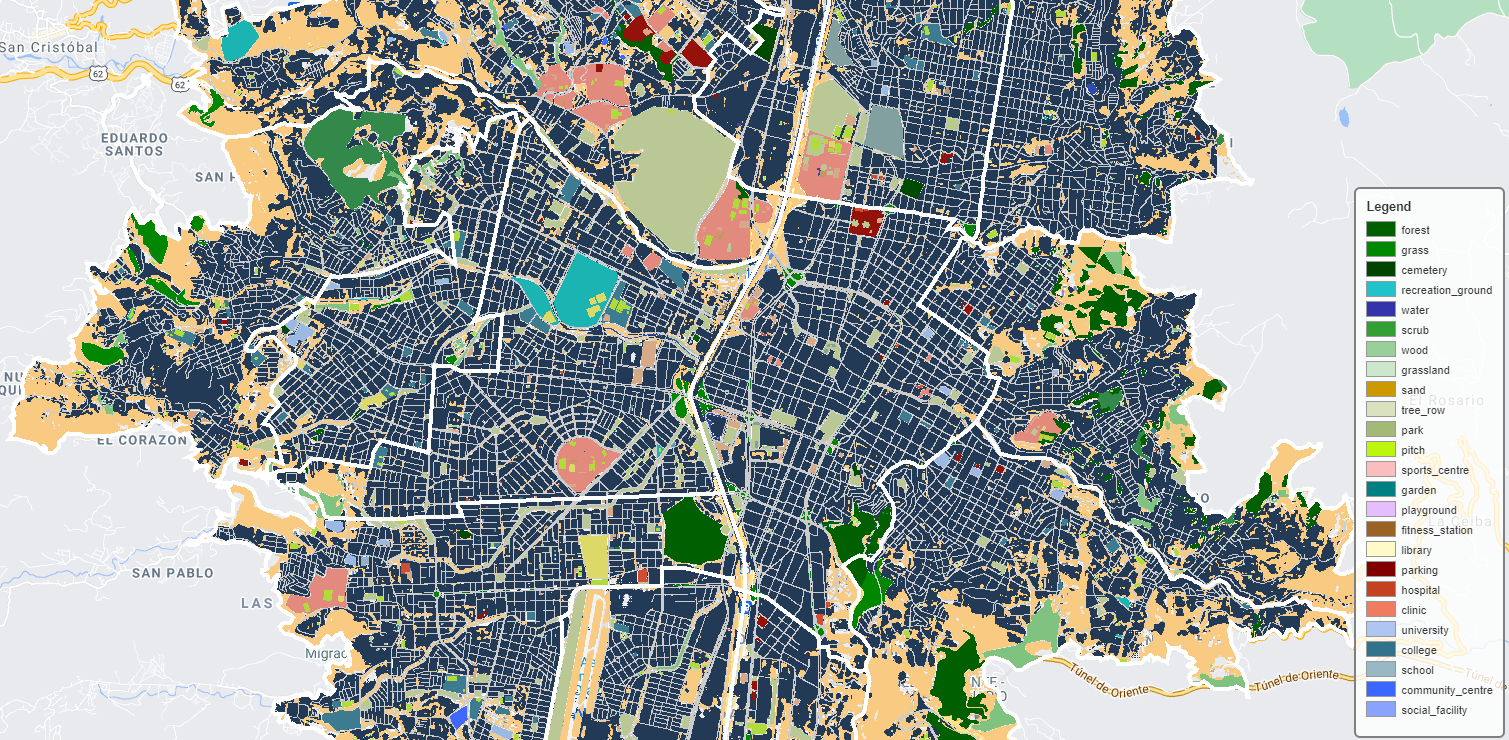
The calculation of indicator 11.7.1 involves four distinct components. The baseline is the build-up area, displayed in a dark blue color on the map. As a second layer, we applied the extracted data from OSM. The exact type of public space is described in the legend on the right side. In a third step, the street network is added (grey lines). The fourth and final layer incorporates the vegetation areas classified by NDVI threshold and visualized in yellow on the map. It is a matter of opinion whether to include them in parts, so far there is no standard for this indicator. These four layers together cover the city almost completely.
| Medellin | Popular | El Poblado | |
| Potential Public Spaces | 13,0% | 16,6% | 11,8% |
| Streets | 17,1% | 16,6% | 19,0% |
| Total Share | 30,0% | 33,2% | 30,7% |
| Vegetation Areas | 16,4% | 3,8% | 30,5% |
From the numbers, we find that streets make up the largest proportion of open space. The proportions do not differ much between neighborhoods, and the same is true for public places like markets and squares. The opposite is true for other vegetation areas: Here the neighborhood El Poblado clearly stands out.
We have tested the method on the example of Medellin, to calculate the indicator at the country level, it must be rolled out to other cities. A comparison with other countries is not easy, as only a few report this indicator. In Latin America, DANE is a pioneer. Denmark reports 26% for the indicator, of which 15% are roads. In England however, roads are not included at all and the indicator calculates at 5%.
OSM always provides the current state, a historical query is not possible. In order to remain consistent, the classification of the built-up areas should therefore also originate from the current year. Since this was not yet available, we classified built-up areas on recent satellite images ourselves using machine learning. We will cover this point in more detail in our next blog post.