Make cities and human settlements inclusive, safe, resilient and sustainable: Tracking SDG 11 with alternative data
May 19, 2021
Erik Lehmann
Context
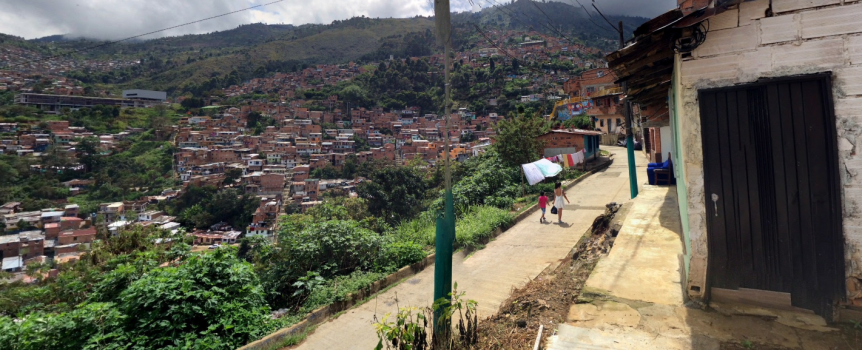
Today half of the world's population lives in urban environments and according to current estimates, this figure will grow up to two-thirds: 6.5 billion people by the middle of this century. Most of this migration will take place in the developing world with limited capacities for urban planning. While cities are social centers and the drivers of economic growth and culture, they are also characterized by large social disparities. Rapid urbanization favors the emergence of informal settlements which often lack basic infrastructure like water supply, sewage, electricity, or paved roads, with tremendous impact on social life, health and security. The limited connection to the urban center and access to public transport prevents several people from entering the regular labor markets – accordingly, poverty can increase and create a downward cycle of limited opportunities. Globally, 30% of the urban population lives in such precarious conditions, in multiple African cities it even exceeds 50%. Informal settlements are not the exception but the norm.
In addition, urbanization also impacts official settlements, cities struggle with insufficient road networks, lack of public transport, and traffic congestion. This increases the cities’ current carbon footprint to a share of 75% with major implications on the quality of life and aerial pollution.
Within this context, SDG 11 puts emphasis on the key figures of urban growth to help city planners and policymakers proactively plan, create and sustain a resilient living environment. In partnership with Colombia’s national statistical office DANE, Partners for Review, and Maptailor Geospatial Consulting, the GIZ Data Lab took a closer look at the potential of alternative methods and data sources for the reliable estimation of the indicators of SDG 11. In this first article, we take a closer look at the dynamics of urbanization in Medellin, assessing the growth of the city and its population.
Indicator 11.3.1: Ratio of land consumption rate to population growth rate
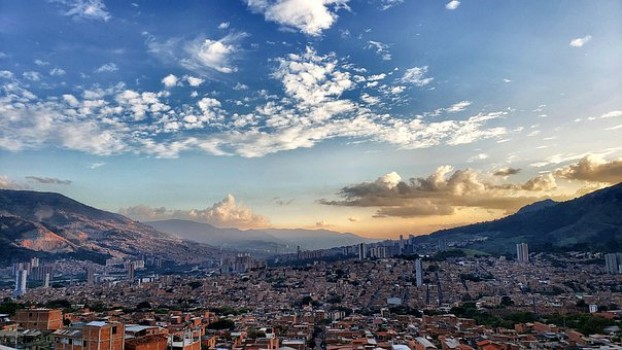
With about 2.5 million inhabitants, Medellin is the second-largest city in Colombia. Its growth from just under 350 thousand in 1950 is exemplary and a blueprint for urbanization in developing countries.
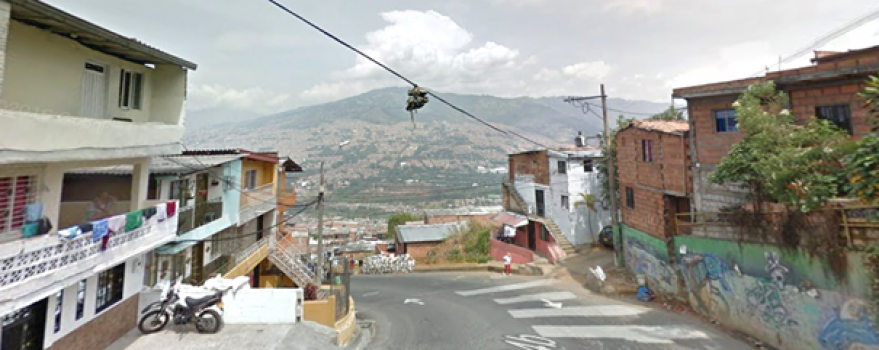
Colombia is one of the countries with the highest number of internally displaced people worldwide. Millions of people moved into the cities because of civil war and drug trafficking. Medellin itself was not known as a safe harbor but for its high crime rate and poverty. Cartels influenced the development of the entire city, whereas the places of conflict were mainly the informal areas with limited police and municipal security services. Fortunately, targeted social urbanization programs focusing on the marginalized communities have successfully managed to change the city and its global perception. Today it is one of the main tourist destinations in Colombia and an international benchmark for sustainable urban development.
Using Medellin as a representative use case, DANE, Map Tailor and the GIZ Data Lab looked at how the city and its population have developed from 1990 to 2015. We used satellite imagery and other geospatial data to measure and correlate urban and population growth.
“MapTailor set up analytical codes to create maps of the SDG indicator 11.3.1, based on freely available remote sensing images and other geodata of population density, urban areas, vegetation cover, and others. The analytics codes were designed as a basis for SDG indicator mapping tools, which scale in space and time. The method follows recommended workflows of the Joint Research Centre (JRC) of the European Commission.” - Elisabeth Fliemann (MapTailor)

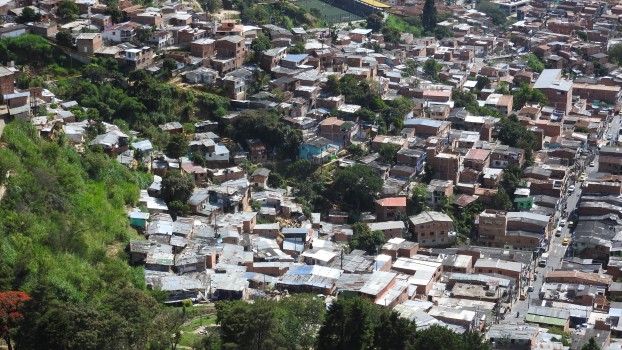
In 1990, the population nestled in the mountains had grown to about 1.7 million people. The buildup area of the city in 1990 was derived from Landsat satellite images with a resolution of 38 meters by EU JRC and published in the Global Human Settlement Layers (GHSL). We aggregated the buildup data on census blocks created by DANE for statistical purposes, where the darker blocks indicate a higher proportion of the built-up area. The population grid also originates from the GHSL and has a resolution of 250 meters per pixel. El Poblado in the south of Medellin was the neighborhood with the most inhabitants in 1990 with more than 10% of the population. It is also the largest neighborhood in terms of area, with almost 14% of Medellin's total space. Setting the population in context to available living space, El Poblado was only second last concerning its density. According to our analysis, the most densely populated districts were not the city center (La Candelaria, Laureles-Estadio, La América), but Popular and Santa Cruz in the north of the city. Looking more closely at the map we can observe the gridded city fading out to curved paths up to the hills indicating most likely informal and poorer settlements to begin.
By 2015, an additional 0.7 million were added to the city with a total of 2.4 million inhabitants. We extracted the shapes of the neighborhoods of Medellin, from Open Street Map to receive a higher-level view.

Map two and three show the relative difference to 1990 in build-up share and population at neighborhood-level. The migrated population spread throughout the city and every neighborhood records growth – particularly the southern districts Buenos Aires, El Poblado, and Belín, are reporting the strongest relative growth. Here, city authorities have managed to accommodate the majority of new residents in previously less densely populated areas. Along with the population, the number of new buildings is also growing, especially in the southern neighborhoods. Even more insightful is the comparison between the growths. In cases where the population grows faster than the built-up area, the number of people per built-up entity becomes denser.

This relationship represents the SDG 11.3.1 - land consumption rate (LCR) as well as the population growth rate (PGR). For the city in general, the population has grown twice as fast as the built-up area between 1990 and 2015. A LCRPGR indicator less than one implies densification, greater than one a loosening of residents per built-up unit. Due to its geographic location and continued migration, the city continues to densify with an LCRPGR of 0.41. Due to high construction activity in El Poblado, the indicator is greater than one, whereas the already dense settlements in Popular offer little opportunity for new construction and face further densification
The aggregation of the LCRPGR on the fine-grained census blocks shows a more detailed picture of where Medellin’s population densified. Although the resolution of the data and their aggregation is not sufficient to interpret each individual block, it shows that the growth of the blocks varies a lot. A characteristic trend for urbanization in developing countries is the growth of settlements on the peripheries of the city. Integrating these often marginalized settlements into the cities infrastructure is a major challenge of sustainable urban development. To assess the inclusiveness, safety, resilience, and sustainability of urban growth, we also had a look at the access to safe and inclusive green and public spaces.
For more details on the methods and data used, check out our notebook on GitHub! We have documented our methodology in detail to enable replication in other contexts. Feel free to share your experiences with us!