DPPD Masterclass - Liveblog
September 30, 2022
Andreas Pawelke, Basma Albanna, Lea Voigt
Together with the GIZ Sector Network Rural Development Asia and the Pacific and the Sector Network Rural Development Africa, we are running a Masterclass on the Data Powered Positive Deviance (DPPD) method.
We are working with 14 GIZ teams from eight countries to equip participants with a systematic and proven way of using the increasingly available data to tackle development challenges. Using a cohort-based course format with a mix of live sessions, video lectures and individual mentoring, we help the teams develop designs of DPPD use cases in climate change mitigation and adaptation.
This blog will be updated regularly with insights from the Masterclass and the use cases that are coming to life through it. Every week you will receive new insights into the DPPD method, including when to use the method, how to best develop your own DPPD idea and what data sources to use. If you are interested in learning more about how to apply the DPPD method to climate change mitigation and adaptation challenges or even want to develop your own DPPD design, check this blog regularly and follow along.

What participants say about the Data Powered Positive Deviance (DPPD) Masterclass (December 13, 2022)
We asked three participants about their experiences with the DPPD Masterclass, organized by the GIZ Data Lab. Here is what they had to say:
Janice Kanyire Annyaah, Market-Oriented Value Chains for Jobs and Growth in the ECOWAS Region (MOVE), GIZ Ghana

Why did you apply for the DPPD Masterclass?
I wanted to learn about the Positive Deviance approach and understand how to harness digital tools and non-traditional data resources in tackling complex development challenges.
My project focuses on climate change mitigation and adaptation in the rice and cashew value chains. I was motivated to join the Masterclass so I could understand how to use data to tackle climate change challenges in those value chains.
What challenge does your team tackle and how can DPPD help?
The recent changes in climatic conditions have led to negative effects on the quality and quantity of yields in the cashew and rice sectors in Ghana and across West Africa.
My team focused on the issue of rice yields being affected by the constant changes in rainfall patterns in the northern part of Ghana.
DPPD can help us identify farmers in that particular region who have adopted unconventional methods in efforts to adapt to the current climatic conditions as well as improve rice yields on their farms.
What are your main takeaways from the Masterclass?
The weekly two-hour live sessions gave me a good general understanding of how to approach development challenges. In carrying out a potential intervention, the use of more conventional approaches like Positive Deviance are as important as digital tools and resources like non-traditional data.
There is a wealth of data that is readily accessible, such as satellite imagery, to measure the performance in different scenarios. Such tools, however, have a somewhat steep learning curve and require dedication to mastery.
What surprised or inspired you the most?
During the Masterclass, I was mostly inspired by the vastness of existing digital data sources to be used in DPPD.
What are your next steps?
The knowledge and skills I have gained from the presentations by the course instructors as well as the discussions with colleagues have given me a good overview of how digital data can be used to tackle development challenges. I will apply these learnings in identifying and scaling climate-adaptive farming methods for both cashew and rice production.
Johanna Braun, Sustainable Agriculture for Forest Ecosystems, GIZ Germany

Why did you apply for the DPPD Masterclass?
As someone who has worked at the intersection of agriculture and digitalisation, I have closely followed the work of the GIZ Data Lab.
Over the past year, I have read a few articles about the DPPD pilots and was very curious to learn more. I thought the method could be relevant to my work as it would allow me to build on local solutions.
Also, the DPPD method forces us to look into a local context systematically and think about the connections between the different factors contributing to a specific development challenge.
What challenge does your team tackle and how can DPPD help?
Together with my team (Malina Bischoff and Daniel Wallmann), I investigate deforestation caused by smallholder farmers in and around the municipality of Altamira in Pará, Brazil. We wanted to understand why some farmers deforest and some don’t.
One of our hypotheses is that growing cocoa, which is a cash crop and can be grown within agroforestry structures, might reduce the pressure to expand agricultural production and hence reduce deforestation. But there are probably a lot of other practices and behavioural aspects that we are not aware of yet. DPPD can help us both with testing our hypothesis as well as looking for further behaviours that can result in less deforestation.
What are your main takeaways from the Masterclass?
The DPPD method is very useful when it comes to analysing a particular problem. It really forces you to look into the complexity of the problem you are trying to address and separate structural from behavioural variables as well as assumptions from facts.
Another takeaway is that finding the right data is tricky and that you really need local knowledge. We are planning to measure deforestation on different agricultural plots and then take a closer look at the statistical outliers, i.e., those farmers that deforest less. We will control for the type of crops farmers are growing, their gender and their income. It will be difficult to get sufficiently granular data to compare individual farmers and some satellite data on where cocoa is grown is still quite new and therefore not easily accessible.
What surprised or inspired you the most?
I was surprised that DPPD focuses on tackling behavioural problems. That wasn’t clear to me before applying to the course.
I was very impressed by the knowledge and experience of the instructors with designing a DPPD project and how they were able help us in in the mentoring sessions.
It might sound like a small detail, but the templates and tools on the Miro board with dedicated areas for brainstorming were very helpful and a great starting point for the discussions we had as a team.
What are your next steps?
We are planning to implement the pilot as part of the GIZ project I am part of (Sustainable Agriculture for Forest Ecosystems, SAFE).
I am very curious to see whether we can use SAFE’s baseline data to refine our pilot design. At the end of this process, we want to be able to identify and scale local solutions to help reduce deforestation.
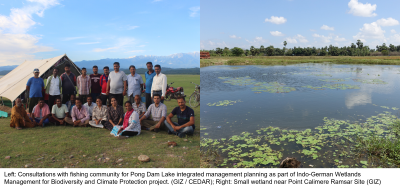
Kunal Bharat, Wetlands Management for Biodiversity and Climate Protection, GIZ India
Why did you apply for the DPPD Masterclass?
I came across DPPD as a method early this year during a knowledge sharing sessions. It left an impression as an alternative approach for developmental challenges using non-conventional data and my curiosity landed me at the GIZ Data Lab blog. The DPPD pilots and handbook were quite interesting. However, I had several questions regarding the method which I thought a Masterclass would help me answer.
What challenge does your team tackle and how can DPPD help?
India has more than 750,000 wetlands which directly and indirectly support the livelihoods of millions of Indians while also supporting a wide range of habitats and biodiversity.
However, many wetlands are threatened by reclamation and degradation due to unsustainable urbanization, agricultural expansion, pollution and overuse. The effects of climate change further aggravate the situation.
Through this DPPD pilot we seek to address wetland loss and degradation with a focus on community-managed wetlands in India. We are trying to determine groups in a pilot region with healthy community-managed small wetlands and scale their practices to other individuals or group in the region.
What are your main takeaways from the Masterclass?
DPPD is not a silver bullet for all developmental challenges and therefore one of the key takeaways for me during the first session was understanding the type of challenges where such a method is quite effective. The subsequent sessions provided a clear framework to break down our use case and the required data and capabilities.
What surprised or inspired you the most?
I found the stepwise presentation of the DPPD case study on wheat cultivation in India extremely useful in removing some of the ambiguity when it comes to actual implementation of the method.
The introduction to Google Earth Engine piqued my interest and so I dived deeper into it as a tool and source of data.
In addition, the innovative use of online whiteboard tools as the class “black board” is commendable.
What are your next steps?
The DPPD method is an added perspective I’ll carry with me for all future projects. Sourcing solutions from within the community encourages ownership and helps scale-up effective traditional as well as new innovative practices. It is going to help me find local “homegrown” solutions to environmental challenges.
We hope to take our use case into implementation as part of the Wetlands Project and scale-up results through regional and national wetland missions which have people’s participation in wetland management as an integral component.

Week 5 Intervention Design (November 9, 2022)
Authors: Andreas Pawelke, Basma Albanna
In the last session of the DPPD Masterclass, we provided the teams with an overview of all the remaining stages and learned from an expert how to design effective social and behavior change interventions.
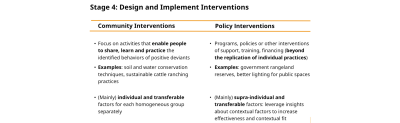
In DPPD we differentiate between two different types of interventions:
- Community interventions focus on enabling and supporting positive deviants to share their positively-deviant strategies and practices with others.
- Policy interventions go beyond the sharing of individual practices and look at adjusting system-level factors that could influence outcomes.
To demonstrate how the choice and design of the interventions follow from the analysis of data and synthesis of insights from the previous stages, we applied the DPPD Variable Mapping tool that we introduced in Session 4 (see the blog post below) using the DPPD food insecurity in Niger pilot project as an example.
Source: DPPD Handbook 2021
We control for supra-individual factors that are not transferable (quadrant 1) through homogeneous grouping and for individual factors that are not transferable (quadrant 2) within the homogeneous groups. Quadrants 3 and 4 will help uncover factors that could inform interventions at different levels. They can be community interventions that enable people to share, learn and practice the behaviors of positive deviants, but also programs (e.g. low-cost pest control methods), policies or other interventions of support, training, financing that go beyond the replication of individual practices (e.g. government policies on forestation).
This blog post marks the end of the Masterclass which focused on the application of the DPPD method in climate change mitigation and adaptation. In the final session we covered the remaining three stages of the DPPD method that are concerned with uncovering positively-deviant strategies and practices, designing interventions and monitoring and evaluating their effects.
Following the Masterclass, the teams developed use case proposals demonstrating how they would go about applying the DPPD method in response to the climate change challenges they submitted upon applying for the Masterclass. We hope to see those proposals materialize into effective interventions in the coming year.
Week 4 Variable Mapping (November 2, 2022)
Authors: Basma Albanna, Andreas Pawelke
In Session 4 we discussed Stage 2 of the DPPD method (determine positive deviants) which looks into performance measurement, followed by homogeneous grouping and positive deviant identification, and finally the preliminary validation of the identified positive deviants.
A range of factors influence to what extent an individual outperforms and therefore might be considered a positive deviant. This includes their distinct strategies and practices, but also factors that are given, e.g. soil quality, or are beyond the influence of the individual, e.g. government subsidies and other interventions. Analyzing and controlling for these factors is important to make sure we are able to identify true positive deviants based on their uncommon, but successful behaviors and not due to structural and contextual factors.
This is where the DPPD Variable Mapping tool comes in. We introduced the tool to help participants map out the possible control and independent variables in order to select the most suitable variables for the homogeneous grouping and the positive deviant identification steps of Stage 2 as well as the identification of positively deviant behaviors in Stage 3.
Source: DPPD Handbook 2021
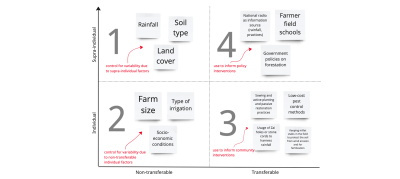
The X-axis shows to what extent the predictor variable is behavioral and could therefore potentially be transferred from one person, community or unit to another. The further to the right, the more the behavior can be shared with other members belonging to the same homogeneous group.
The Y-axis shows to what extent the predictor variable is individual or supra-individual (beyond the control of the individual). The more the variable is supra-individual and non-behavioural, the more suitable for homogeneous grouping it becomes.
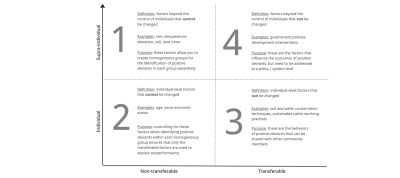
Using this tool you will be able to categorize and map the variables into four main types:
- Supra-individual, non-transferable factors (quadrant 1) allow you to create homogeneous groups based on factors beyond the control of individuals that cannot be changed but which influence outcomes, mainly physical factors. Examples include using rainfall, temperature or soil quality to create agricultural peer-groups for the identification of positively deviant farmers in each group separately.
- Individual, non-transferable factors (quadrant 2) are used to control for individual-level factors that can influence outcomes but cannot be changed, e.g. age. Those variables need to be controlled for when identifying positive deviants within each homogeneous group to ensure that the variance in performance is mainly due to transferable factors. They will act as independent variables in the prediction of performance given which positive deviants will be identified from the residuals i.e. how far they are – in a positive way – from what was predicted.
- Individual, transferable factors (quadrant 3) refer to all the behaviors of positive deviants that can be shared with other community members, e.g. soil and water conservation techniques. Those variables are used (after the positive deviant identification) in inferential statistical tests and regressions analysis to check if they have a significant effect on the positive outcomes.
- Supra-individual, transferable factors (quadrant 4) are variables that are beyond the control of individuals and can be transferred at the system level, e.g. government policies. Those variables are also used in inferential statistical tests and regression analysis to identify key differentiators and determinants of positively-deviant performance.
Selecting which variables are better suited for which step in the analysis is one of the toughest decisions to make when applying the DPPD method. The Variable Mapping tool can make this process easier as it provides a simple way to distinguish variables based on their role in either identifying or explaining deviance.
Week 3 Use Case Insights (October 26, 2022)
Author: Lea Voigt
From wetland restoration in India to agroforestry in Brazil. This week we will introduce four use cases teams work on as part of the DPPD Masterclass.
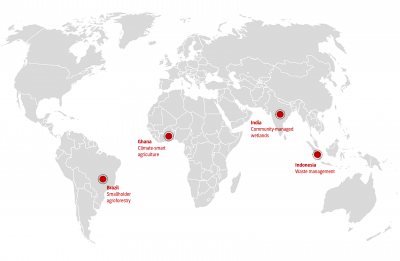
Community-managed wetlands in India
Almost five percent of India’s total land area is covered in wetlands such as lakes, mangroves, and floodplains. The wetlands not only provide fresh water, flood control and biodiversity, they also directly or indirectly support the livelihoods of millions of Indians.
Over the past 30 years, almost a third of these wetlands have degraded or been lost – a process fuelled by human activity. Despite the odds, there are some communities that actively manage or have even succeeded in restoring degraded wetlands.
Identifying the solutions of these communities and sharing the knowledge behind them could help other communities keep their wetlands healthy and reap environmental and economic benefits, while adapting to a changing climate.
Climate-smart agriculture in Northern Ghana
In Northern Ghana, changes in weather, resulting in prolonged drought seasons and flooding, affect the agricultural output of farmers’ rice paddies. The problem is exacerbated by farm machinery inefficiencies and leads to lower incomes and food insecurity in farming households.
Some farmers have found ways to retain moisture on their farms in events of droughts as well as avoid flooding during heavy rainfall. The team aims to identify those farmers who adopted such practices so that they can be shared with other farmers who also suffer from the effects of the climate crisis.
Waste management in Indonesia
According to the World Bank, around 400,000 metric tons of waste are predicted to be produced in the ASEAN region per day by 2025. Population growth, rising prosperity and changing consumer habits are leading to significantly increasing quantities of waste. Only a portion of that land-based waste is collected, recycled, or disposed of properly and large volumes are leaking into marine waters, polluting our oceans.
The team from Indonesia aims to identify communities with higher waste separation rates and effective waste separation systems. Understanding how these positive deviants manage their waste more effectively could help build systems to better manage land-based litter and prevent it from spilling into the ocean.
Smallholder agroforestry in Brazil
The team from Brazil is applying the DPPD method to identify solutions to tackle deforestation using agroforestry systems. While forests play a crucial role in regulating climate by producing atmospheric moisture and rainfall, they are threatened by agricultural expansion.
Agroforestry systems could be a climate change mitigation and adaptation solution since they enable the effective management of farming plots without contributing to deforestation or forest degradation. Positive deviants in this case would be farmers who do not engage in deforestation and sustainably manage natural resources while facing similar socioeconomic conditions. Successful agroforestry systems could be scaled to help other farmers and thereby reduce the rate of deforestation caused by agricultural activities. Not only would this be beneficial for the health of forests, but it would help local farmers become more resilient against the effects of the climate crisis.
The teams are now working on mapping data sources to capture the outcomes of the observed population (outcome data) and to control for external factors (contextual data).
Week 3 Reflections (October 21, 2022)
Author: Andreas Pawelke
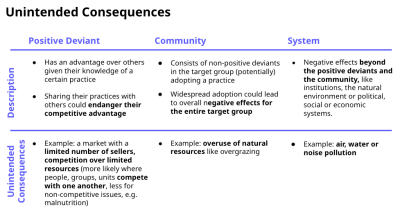
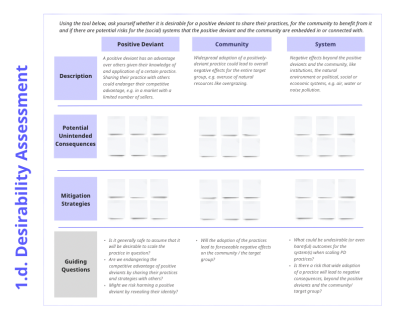
In week three of the Masterclass, we worked with the teams on their desirability assessments. Following the Do-No-Harm principle, this involves the responsible use of data as well as identifying (and mitigating) potential unintended consequences that might result from others adopting the practices of positive deviants.
Such negative effects can happen on three levels:
- the positive deviant that has developed a practice leading to outperformance,
- the community of largely non-positive deviants that might adopt the practice,
- the wider systems that the positive deviant and the community are embedded in or connected with.

Positive Deviant
It’s generally safe to assume that positive deviants are not aware of their innovativeness and/or of the success of their uncommon practices and strategies. In some cases, however, they may be aware of it and may choose not to share their strategies with others in their community for fear of losing their competitive advantage or depleting a resource they alone are aware of.
This is less likely an issue where cultural norms dictate against competitive strategies, such as child malnutrition or health care, but it might be problematic in areas where people more overtly compete with one another.
Community
Here we ask to what extent a practice would really lead to positive sustainable effects for the entire community if adopted by non-positive deviants.
For instance, scaling the practice of a positively-deviant pastoralist might lead to an increase in pastoral activities and livestock numbers. However, over time this might result in a shortage of grazing land, eventually leading to the obsolescence of the positive practice.
Systems
While difficult, it is also worth reflecting on potential negative effects beyond the positive deviants and the community, such as the natural environment and political, social or economic institutions and systems. Examples include air, water or noise pollution.
We then walked the participants through examples like the one pictured below. This one is based on a case from Bangladesh where the introduction of shrimp aquaculture seemed like a cleer climate-change adaptation, but which has caused huge unintended consequences.
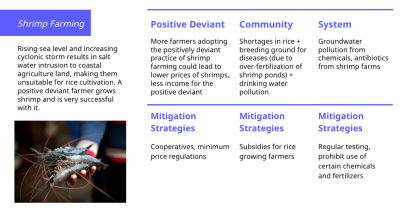
We also discussed mitigation strategies before the teams then worked on their own use cases to identify and assess potential unintended consequences and ways to avoid or mitigate them using the tool below.
In next week’s session we will talk about Stage 2 of the DPPD method where the teams will learn to determine and validate positive deviants using homogeneous grouping and performance measurement techniques.
Week 2 Reflections (October 18, 2022)
Author: Basma Albanna
In the second week of the DPPD Masterclass, we focused on data mapping and how to identify potential data sources. When applying the DPPD method, Earth observation data (EO) specifically plays an important role. EO data provides information about the physical, chemical, and biological systems of the planet using remote sensing technologies. It is considered the most cost-effective technology able to provide data at a global scale. It can be acquired at low cost, over long periods of time, and thanks to the recent advances in remote sensing technologies, it is witnessing a growing availability at a high-resolution including coverage of low-income countries where other datasets are lacking. After applying the DPPD method in multiple domains, we learned that EO data can play an instrumental role in scaling the DPPD method.
This was also evident when we did a data mapping exercise with the participants during which we looked for the right data match with their climate change mitigation and adaptation use cases. More than 80% of the use cases had outcome indicators, i.e., a performance measure that could enable the identification of positive deviance within the target group, that could be captured using EO data. Based on the positive deviants identified using EO data in the first step, it is then possible to detect local solutions using supplementary (qualitative) data in a second step.
EO data is also suited to control for key contextual factors such as climate events, biophysical drivers, land cover, and to complement traditional data to develop high resolution spatial data on population distributions, demographics and dynamics. The figure below presents a snippet of some data matching that we did to be able to capture contextual factors and possible outcome measures. It covered four main thematic groups which participants’ use cases were divided into: climate-resilience, nature conservation and restoration, climate-smart agriculture and pollution prevention.

Examples of possible EO-based outcome measures range from the use of remote sensing derived vegetation indices (e.g., SAVI, NDVI) to identify climate-resilient agricultural communities to finding healthier community-managed wetlands using Sentinel-2 based classification and change over time. We are also looking into using Sentinel-5p data to identify environmentally-friendly industrial parks and the use of Landsat to identify communities deforesting less than expected.
Attributes of EO data (high temporal, spatial and spectral resolution) make it possible to overcome a number of common data accessibility and representation limitations, while being able to capture the potential gains of using big data in positive deviance such as reducing the cost, time and risk of measuring performance at large scale. Of course, limitations must be acknowledged given that EO data is applicable only in DPPD projects where the impact of human behaviours and practices on natural and built environments can be observed and measured remotely. It nonetheless remains a low-hanging fruit for the application of DPPD in climate change mitigation and adaptation given its accessibility, coverage and low cost.
Week 1 Reflections (October 7, 2022)
Author: Andreas Pawelke
We know it can be difficult to understand all the technical aspects of the DPPD method (how to define the unit of analysis, how to identify suitable data sources, how to figure out what data to use as control variables, how to access to data and so on). But we sometimes forget how challenging it is for those new to the method to adopt a way of (conceptual) thinking that they might not be used to.
The conventional thinking in international development goes something like this: We identify a problem, analyze what is going on, devise and implement a plan on how to fix what is broken and, if all goes well, there is going to be a positive outcome.
PROBLEM → ANALYSE → SOLVE
With DPPD we take a different path. Here we assume that a solution to a given problem exists. We try to find those who own the solution and help them replicate or scale it.
SOLUTION → IDENTIFY → SCALE
Instead of asking “what problem can we solve here”, DPPD requires us to think about how to identify (and scale) existing solutions and work with the individuals who developed them. For the development practitioners applying the DPPD method that means going from being the creator of a solution to becoming a facilitator in the search for solutions.
We are of course not the first to apply this type of thinking. Practitioners of the Positive Deviance approach have long based their work on the premise that we should work with those individuals who achieve better results than their peers. The Honey Bee Network maintains a database of over one million ideas, innovations, and traditional knowledge practices. And the UNDP has built a whole network of labs across the globe to learn from local innovations to inform development interventions.
While week 1 of the DPPD Masterclass was all about helping the course participants shift from the conventional to a more asset-based, solution-oriented thinking, in week 2 we will be looking into the other core element of the method: leveraging digital data sources to aid in the identification of potential positive deviants.

Kick-off (October 4, 2022)
Author: Lea Voigt
Before being accepted to take part of the Masterclass, participants needed to apply for the Masterclass, presenting a potential use case to apply the methodology in the field of climate change. Following this application process, over 30 participants from 8 countries were selected and kicked off the DPPD Masterclass with us.
After completing a fun icebreaker that allowed the teams to bundle their creativity and create their own team-elephants made entirely out of virtual sticky notes (with impressive results), the participants learned about DPPD as a method to help development practice shift from top-down identification and tackling of development challenges to focusing on communities’ inherent assets and capabilities as the ultimate starting point in the search for solutions.
The participants then took initial steps to refine their own use case designs which they submitted as part of their application. They did so, using a set of questions to define the problem they want to focus on and by assessing the suitability of the DPPD method to tackle that particular problem type. The use case designs reflect a wide range of development issues that the GIZ and its partners are working on across the world. This ranges from identifying cocoa farmers in Brazil who are deforesting less than their peers to fisheries in the Philippines that achieve higher than expected yields.
We had an intense but hopefully rewarding first workshop and we look forward to our next session. Stay tuned for our next blogpost in which you will learn more about the DPPD method and the conceptual thinking behind it.

Why we decided to Launch the DPPD Masterclass (September 30, 2022)
Author: Lea Voigt
The recent growth in the availability of non-traditional data sources (e.g., from satellites or mobile phones), offer new and exciting opportunities to tackle development challenges, but the full potential of many of these data sources remains largely untapped. At the same time, development cooperation often still offers top-down solutions to partner countries and doesn’t focus enough on the potential of local knowledge and innovation. This is why – based on the groundwork of Dr. Basma Albanna – the GIZ Data Lab and partners refined and applied the Data Powered Positive Deviance Methodology in various pilots worldwide. Given the proven potential of DPPD, we decided to support GIZ staff to apply it in their context. To do so, we set up a Masterclass for GIZ staff on the use of non-traditional data to identify positive deviants and thereby tackle development challenges in the field of climate mitigation and adaptation.
To understand what this entails, let’s look back at the idea behind Positive Deviance and the DPPD method:
Positive Deviance is based on the observation that in every population there are individuals or communities who, despite facing similar challenges and limitations, achieve better results than their peers. Amplifying and scaling the solutions of positive deviants can help shift from top-down identification and tackling of development challenges to focusing on a community’s inherent assets and capabilities making such solutions more likely to stick and less vulnerable to social rejection.
The Data Powered Positive Deviance method follows the same logic but uses pre-existing, non-traditional data sources, e.g., satellite imagery, instead of — or in conjunction with — traditional data sources e.g., surveys, statistics.
The goal of the Masterclass is not only to help participants understand the DPPD method as a novel way of using data but also to support them in developing an initial design for a DPPD use case to potentially implement in the future.
We are excited to share what we have learned from the pilot projects as part of the DPPD Initiative and look forward to kicking off the Masterclass.