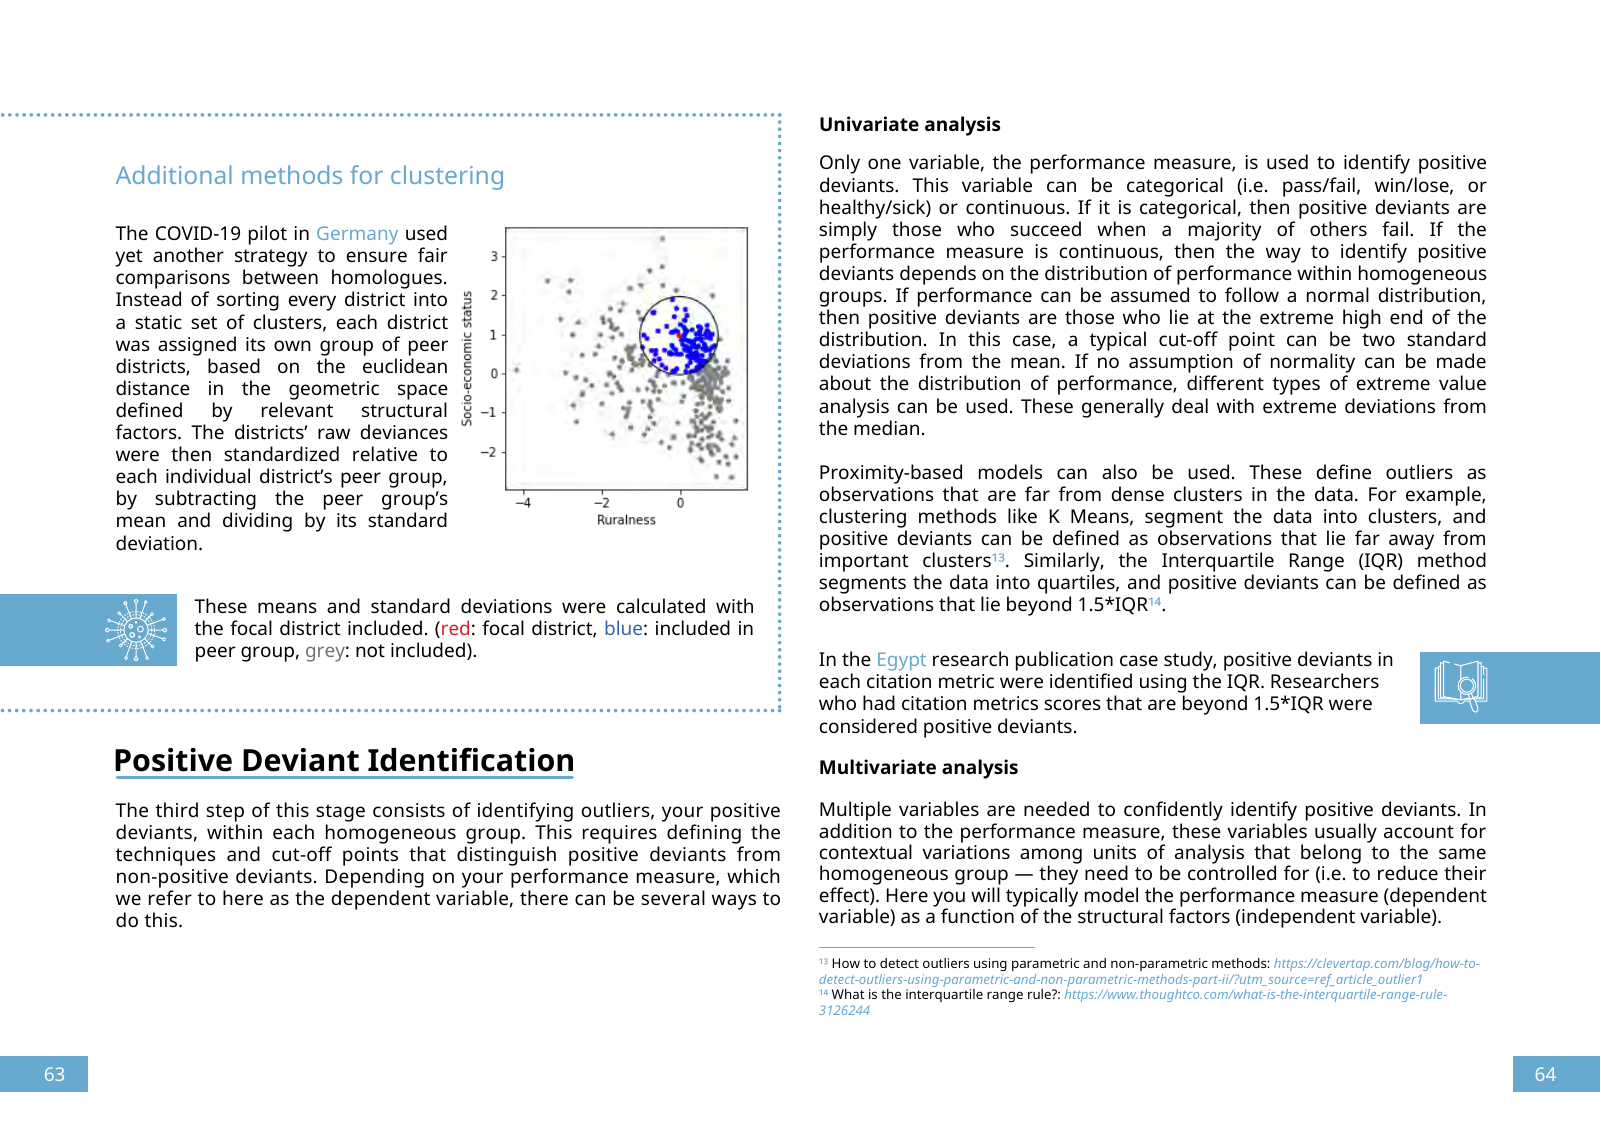
Positive Deviant Identification Additional methods for clustering The COVID 19 pilot in Germany used yet another strategy to ensure fair comparisons between homologues Instead of sorting every district into a static set of clusters each district was assigned its own group of peer districts based on the euclidean distance in the geometric space defined by relevant structural factors The districts raw deviances were then standardized relative to each individual district s peer group by subtracting the peer group s mean and dividing by its standard deviation These means and standard deviations were calculated with the focal district included red focal district blue included in peer group grey not included The third step of this stage consists of identifying outliers your positive deviants within each homogeneous group This requires defining the techniques and cut off points that distinguish positive deviants from non positive deviants Depending on your performance measure which we refer to here as the dependent variable there can be several ways to do this Univariate analysis Only one variable the performance measure is used to identify positive deviants This variable can be categorical i e pass fail win lose or healthy sick or continuous If it is categorical then positive deviants are simply those who succeed when a majority of others fail If the performance measure is continuous then the way to identify positive deviants depends on the distribution of performance within homogeneous groups If performance can be assumed to follow a normal distribution then positive deviants are those who lie at the extreme high end of the distribution In this case a typical cut off point can be two standard deviations from the mean If no assumption of normality can be made about the distribution of performance different types of extreme value analysis can be used These generally deal with extreme deviations from the median Proximity based models can also be used These define outliers as observations that are far from dense clusters in the data For example clustering methods like K Means segment the data into clusters and positive deviants can be defined as observations that lie far away from important clusters Similarly the Interquartile Range IQR method segments the data into quartiles and positive deviants can be defined as observations that lie beyond 1 5 IQR How to detect outliers using parametric and non parametric methods https clevertap com blog how to detect outliers using parametric and non parametric methods part ii utm source ref article outlier1 What is the interquartile range rule https www thoughtco com what is the interquartile range rule 3126244 In the Egypt research publication case study positive deviants in each citation metric were identified using the IQR Researchers who had citation metrics scores that are beyond 1 5 IQR were considered positive deviants Multivariate analysis Multiple variables are needed to confidently identify positive deviants In addition to the performance measure these variables usually account for contextual variations among units of analysis that belong to the same homogeneous group they need to be controlled for i e to reduce their effect Here you will typically model the performance measure dependent variable as a function of the structural factors independent variable 63 64
Hinweis: Dies ist eine maschinenlesbare No-Flash Ansicht.
Klicken Sie hier um zur Online-Version zu gelangen.
Klicken Sie hier um zur Online-Version zu gelangen.